Create your own MLB Prediction Dashboard
Learn how to build a real-time MLB predictions dashboard using the Highlightly Baseball API. Plot win probabilities over time with Chart.js, compare bookmaker odds, and track live prediction shifts during games.
Baseball has always been a numbers game. No sport generates more data per game than baseball. Every pitch has a velocity, a spin rate, a location. Multiply that by 2,430 regular season games, and you start to understand why prediction models love this sport.
Most of that prediction data lives behind enterprise paywalls. Providers such as Sportradar and StatsPerform charge five and six figures for access. That's great if you're ESPN. Not so great if you're a developer who wants to build something cool on a Saturday afternoon.
Highlightly Baseball API provides real-time MLB and NCAA predictions with actual probability percentages, updated every ten minutes during live games. The entire API is accessible through a REST interface and even comes with a free tier.
In this tutorial, we're going to build a complete MLB predictions dashboard from scratch. Our aim is to make a real, working application that fetches live prediction data, plots probability changes over time with Chart.js, compares bookmaker odds, shows team form and head-to-head history, and auto-polls during live games. By the end, you'll have something that looks and feels like a professional sports analytics tool.
You don't need to be a data scientist or a React expert. If you can
write a fetch request and read some
JSONs, you'll be fine. We'll use vanilla JavaScript with React loaded
from a CDN (no webpack and no build step).
Understanding Prediction Data
Before we write any code, let's look at what the API actually gives
us. When you fetch a match detail from
GET /matches/{id}, the response
includes a predictions object that
looks like this:
          {
  "predictions": {
    "prematch": [
      {
        "type": "prematch",
        "modelType": "two-way",
        "description": "Yankees is most likely to win the game against Red Sox.",
        "generatedAt": "2026-03-18T04:51:57.121Z",
        "probabilities": {
          "home": "57.91%",
          "away": "42.09%"
        }
      },
      ...
    ],
    "live": [
      {
        "type": "live",
        "modelType": "two-way",
        "description": "Yankees is most likely to win the game against Red Sox.",
        "generatedAt": "2026-03-18T17:11:17.274Z",
        "probabilities": {
          "home": "55.73%",
          "away": "44.27%"
        }
      },
      {
        "type": "live",
        "modelType": "two-way",
        "description": "Yankees is most likely to win the game against Red Sox.",
        "generatedAt": "2026-03-18T17:21:24.311Z",
        "probabilities": {
          "home": "59.42%",
          "away": "40.58%"
        }
      },
      ...
    ]
  }
}
There are two key things to notice here.
First, predictions are split into
prematch and
live arrays. Prematch entries are
generated 7 days before the game starts and represent the model's
baseline view. Live predictions arrive every ten minutes or so during
the game, updating as the situation changes. Each entry has a
generatedAt timestamp, so you get a
full time series.
Second, the probabilities come as percentage strings like
"57.91%". You'll need to parse those
into numbers, but the format is clean and consistent.
The description field is a natural
language summary from the AI model. It's useful for displaying a
human-readable insight alongside the numbers. The
modelType tells you the prediction
model used. It can be either
two-way which means home win or away
win, or three-way which includes a
draw as well.
This structure is what makes the timeline chart possible. We don't need to store anything on our end. The API hands us the full history of probability changes for every live game.
Project Setup and Authentication
We're going to keep this simple with no webpack and no build step. The
project is an Express server that serves a
public/ folder of static files.
React, Babel, and Chart.js are loaded from CDNs.
Here's the project structure:
          mlb-predictions/
├── server.js                   # Express static server
├── package.json
├── public/
│   ├── index.html              # CDN scripts + module loading
│   ├── css/styles.css          # Theme and animations
│   └── js/
│       ├── api/                # API layer (4 files)
│       ├── parsers/            # Response parsers (5 files)
│       ├── components/         # React components (9 files)
│       ├── utils/              # Helpers (3 files)
│       └── app.jsx             # Root component
The server is a few lines of code:
          const express = require('express');
const path = require('path');

const PORT = process.env.PORT || 3000;
const app = express();

app.use(express.static(path.join(__dirname, 'public')));

app.listen(PORT, () => {
  console.log(`  Running at: http://localhost:${PORT}\n`);
  console.log(`  Powered by the Highlightly Baseball API`);
  console.log(`  Docs: https://highlightly.net/baseball-api/documentation/\n`);
});
That's the entire backend. Everything else happens in the browser.
Since Babel standalone doesn't support
import/export
across files, we use a shared namespace. Every module registers itself
on window.MLB:
          window.MLB = window.MLB || {};
MLB.api = MLB.api || {};

MLB.api.BASE = 'https://baseball.highlightly.net';

MLB.api.fetch = async function (path, apiKey) {
  const response = await fetch(`${MLB.api.BASE}${path}`, {
    headers: { 'x-rapidapi-key': apiKey },
  });

  if (response.status === 401 || response.status === 403) {
    throw new Error('AUTH');
  }

  if (response.status === 429) {
    throw new Error('RATE_LIMIT');
  }

  if (!response.ok) {
    throw new Error(`HTTP_${response.status}`);
  }

  return response.json();
};
The x-rapidapi-key header is the only
authentication you need unless you are going with the RapidAPI
platform. For the Highlightly platform, you can get your key from
highlightly.net
by creating a free account.
Every API response includes
x-ratelimit-requests-remaining in its
headers. This tells you how many requests you have left before hitting
your daily limit. It's a good habit to log this during development, so
you don't burn through your quota while testing.
For key validation, we hit
GET /teams?league=MLB when the user
connects. It's a lightweight call that confirms the key works without
wasting quota on a heavy endpoint.
Fetching Today's Games
The match list is the foundation of everything. One call to
GET /matches?date=2025-04-15&limit=100
gives you baseball games scheduled for that date. Later on you will
need to update this function so that it supports pagination as well.
          MLB.api.fetchMatches = function (date, apiKey) {
  return MLB.api
    .fetch(`/matches?date=${date}&limit=100`, apiKey)
    .then((response) => response?.data || []);
};
Each match in the response has this shape:
          {
  "id": 527959,
  "league": "MLB",
  "season": 2025,
  "state": {
    "score": {
      "away": {
        "hits": 7,
        "errors": 0,
        "innings": [0, 0, 0, 0, 0, 1, 0, 1, 0]
      },
      "home": {
        "hits": 6,
        "errors": 0,
        "innings": [0, 0, 0, 0, 0, 0, 0, 0, 0]
      },
      "current": "0 - 2"
    },
    "report": "Final",
    "description": "Finished"
  },
  "homeTeam": {
    "id": 10291193,
    "displayName": "St. Louis Cardinals",
    "name": "Cardinals",
    "logo": "https://highlightly.net/baseball/images/teams/10291193.png",
    "abbreviation": "STL"
  },
  "awayTeam": {
    "id": 10291181,
    "displayName": "Houston Astros",
    "name": "Astros",
    "logo": "https://highlightly.net/baseball/images/teams/10291181.png",
    "abbreviation": "HOU"
  },
  "date": "2025-04-15T23:45:00.000Z",
  "round": "regular-season"
}
A few things to watch for when parsing this.
The game status lives in
state.description. The possible
values are "Scheduled", "In Progress", "Finished", "Postponed",
"Canceled", "Suspended", "Rain Delay", "Half Time", "Period End", and
"Unknown". For our UI, we collapse these into four buckets:
          MLB.parsers.parseStatus = function (match) {
  const desc = (match.state?.description || '').toLowerCase();

  if (desc.includes('progress') || desc.includes('half time') ||
      desc.includes('rain delay') || desc.includes('period end')) {
    return 'live';
  }

  if (desc.includes('finish') || desc.includes('final')) {
    return 'finished';
  }

  if (desc.includes('postponed') || desc.includes('canceled') ||
      desc.includes('abandoned') || desc.includes('suspended')) {
    return 'postponed';
  }

  return 'scheduled';
};
The score is a string like
"5 - 3" inside
state.score.current. We split on the
dash and parse to integers. The innings array tells us how far along
the game is. Its length is the number of innings played.
We sort the match list so live games appear first, then upcoming followed by finished games. This way the most interesting content is always at the top. The date picker in the header lets users navigate to any date. During the MLB offseason (November through March), most dates will return empty. Stick to late March through October for the full experience.
Rendering Match Cards
Each game gets its own card. The collapsed view shows you everything you need. This includes the two teams with their logos, the score (if the game has started), the league badge, venue name, and start time.
Team logos come directly from the API's
logo field. But logos can fail to
load. Maybe the URL changed, or it's a newly added NCAA team. So we
build a TeamLogo component that tries
the image first and falls back to the team abbreviation in a styled
box:
          MLB.components.TeamLogo = function TeamLogo({ team }) {
  const [broken, setBroken] = React.useState(false);

  if (team.logo && !broken) {
    return React.createElement('img', {
      src: team.logo,
      alt: team.name,
      onError: () => setBroken(true),
      style: {
        width: 40,
        height: 40,
        borderRadius: 10,
        objectFit: 'contain',
        background: 'var(--border)',
      },
    });
  }

  return React.createElement('div', {
    style: {
      width: 40,
      height: 40,
      borderRadius: 10,
      display: 'flex',
      alignItems: 'center',
      justifyContent: 'center',
      fontSize: 12,
      fontWeight: 800,
    },
  }, team.abbr);
};
This kind of defensive rendering matters more than you'd think. It's the difference between a polished app and one that shows broken image icons when the API data isn't perfect.
For live games, we show a pulsing green "LIVE" badge in the top-right
corner. Finished games get a grey "FINAL" badge using the
state.report field. Postponed games
show "PPD" in yellow. These small touches make the interface instantly
scannable.
Parsing and Displaying Predictions
Let's get to the most interesting part.
The challenge is that probability values come as strings like
"57.91%". We wrote a dedicated parser
for this:
          MLB.parsers.parseProbStr = function (value) {
  if (typeof value === 'number') {
    return value > 0 && value <= 1
      ? Math.round(value * 100)
      : Math.round(value);
  }

  if (typeof value === 'string') {
    const num = parseFloat(value);
    if (Number.isNaN(num)) return 0;

    // "55.73%" is already a percentage, just round it
    if (value.includes('%')) return Math.round(num);

    // 0.5573 is fractional, multiply up
    return num > 0 && num <= 1
      ? Math.round(num * 100)
      : Math.round(num);
  }

  return 0;
};
The main prediction parser,
parseAllPreds, reads both the
prematch and
live arrays, extracts the latest
entry from each, and builds the full
liveHistory array for the chart:
          // Returns: { prematch, live, primary, liveHistory[] }
MLB.parsers.parseAllPreds = function (detail) {
  const predictions = detail?.predictions;
  if (!predictions) return null;

  const { parseSinglePred, parseProbStr } = MLB.parsers;

  const toArray = (val) => (Array.isArray(val) ? val : val ? [val] : []);
  const preArr = toArray(predictions.prematch);
  const liveArr = toArray(predictions.live);

  // Take the latest entry from each array
  const prematch = preArr.length
    ? parseSinglePred(preArr[preArr.length - 1])
    : null;

  let live = null;
  let liveHistory = [];

  if (liveArr.length) {
    live = parseSinglePred(liveArr[liveArr.length - 1]);

    liveHistory = liveArr
      .map((entry) => {
        const probs = entry.probabilities || {};
        return {
          home: parseProbStr(probs.home || 0),
          away: parseProbStr(probs.away || 0),
          generatedAt: entry.generatedAt || null,
        };
      })
      .filter((point) => point.home || point.away);
  }

  if (!prematch && !live) return null;

  return {
    prematch,
    live,
    primary: live || prematch,  // Live takes priority
    liveHistory,
  };
};
The primary field is the key
decision. When a live prediction exists, it will show it. When it
doesn't, it will fall back to prematch. This "live-first" rule applies
everywhere through the app (the collapsed card bar, the expanded
panel, and the AI insight text).
For the probability bar, we use different color schemes to visually distinguish prediction types. Prematch predictions render in green (home) and red (away). Live predictions use cyan and orange. This way, even at a glance, you can tell whether you're looking at a pre-game assessment or an in-game update.
Building the Probability Timeline Chart
The API's
liveHistory array is a perfect time
series. Each entry has a timestamp and home/away percentages. Now we
need to plot them.
We use Chart.js loaded from CDN. No npm install and tree-shaking
worries. One
<script> tag and we have a full
charting library.
The chart renders inside a
PredictionChart React component. It
takes the history array and team abbreviations as props. Here's the
core dataset logic:
          // Prematch datasets is dashed baseline when live data exists
if (history.some((h) => h.homePre != null)) {
  const makePreDataset = (label, data, color, rgbaFill) => ({
    label,
    data,
    borderColor: solid ? color : `${color}66`,
    backgroundColor: solid ? rgbaFill : 'transparent',
    borderDash: solid ? [] : [6, 4],
    borderWidth: solid ? 2.5 : 2,
    pointRadius: solid ? 3 : 0,
    tension: 0.35,
    spanGaps: true,
  });

  datasets.push(
    makePreDataset(`${hAbbr} Pre`, history.map((h) => h.homePre), '#22C55E', 'rgba(34,197,94,.08)'),
    makePreDataset(`${aAbbr} Pre`, history.map((h) => h.awayPre), '#EF4444', 'rgba(239,68,68,.06)'),
  );
}

// Live datasets is solid and bold
if (history.some((h) => h.homeLive != null)) {
  const makeLiveDataset = (label, data, color, rgbaFill) => ({
    label,
    data,
    borderColor: color,
    backgroundColor: rgbaFill,
    borderWidth: 2.5,
    pointRadius: 3,
    tension: 0.35,
    fill: true,
    spanGaps: true,
  });

  datasets.push(
    makeLiveDataset(`${hAbbr} Live`, history.map((h) => h.homeLive), '#06B6D4', 'rgba(6,182,212,.08)'),
    makeLiveDataset(`${aAbbr} Live`, history.map((h) => h.awayLive), '#F97316', 'rgba(249,115,22,.06)'),
  );
}
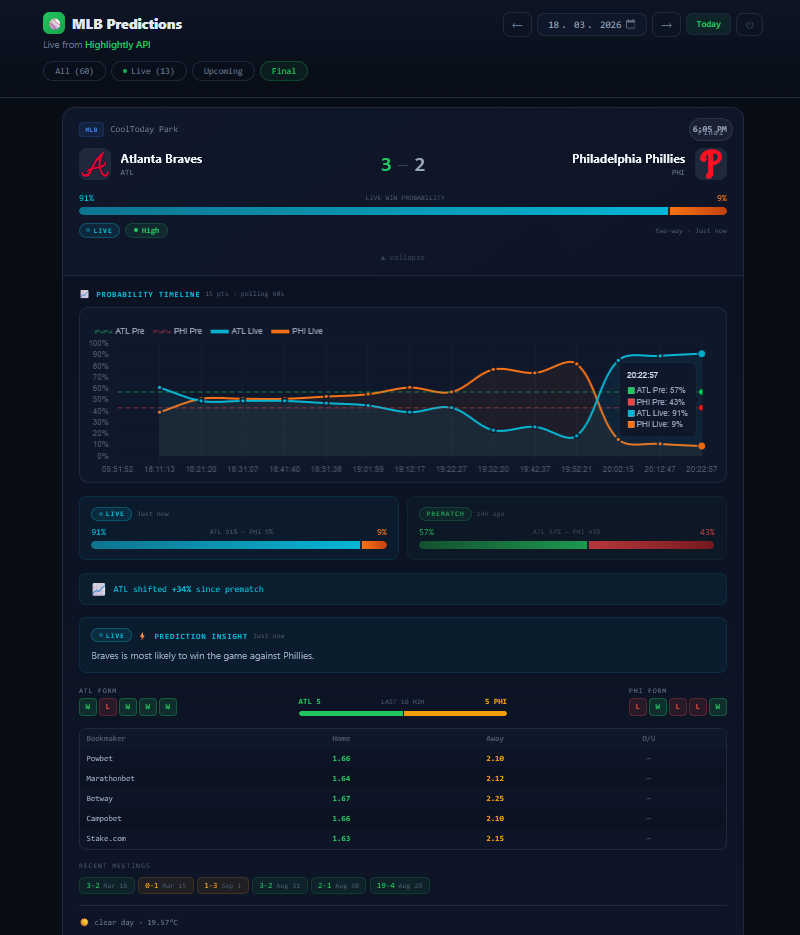
The visual result is intuitive. For a game in progress, you see the prematch values as flat dashed lines (the baseline) and the live values as solid lines that move up and down as the game unfolds. The cyan line is the home team's win probability, and the orange line is the away team's. As one goes up, the other goes down and they always sum to 100%.
We don't build the history by polling. The API already provides every
live snapshot in the
predictions.live array. When the user
expands a card, we fetch
GET /matches/{id} once and the entire
history is there:
          const recordHistory = useCallback((preds) => {
  if (!preds) return;
  const points = [];

  // Prematch baseline as the first data point
  if (preds.prematch?.hasNumeric) {
    const label = preds.prematch.generatedAt
      ? fmtShort(preds.prematch.generatedAt)
      : 'Pre';

    points.push({
      label,
      homePre: preds.prematch.home,
      awayPre: preds.prematch.away,
      homeLive: null,
      awayLive: null,
    });
  }

  // Each live snapshot becomes a chart data point
  for (const snapshot of preds.liveHistory || []) {
    points.push({
      label: snapshot.generatedAt ? fmtShort(snapshot.generatedAt) : 'Live',
      homePre: preds.prematch?.hasNumeric ? preds.prematch.home : null,
      awayPre: preds.prematch?.hasNumeric ? preds.prematch.away : null,
      homeLive: snapshot.home,
      awayLive: snapshot.away,
    });
  }

  points.sort((a, b) => a.ts - b.ts);
  setPredHist(points);
}, []);
For live games, we also set up a polling interval. Every 60 seconds, we re-fetch the match detail and rebuild the chart. New live snapshots that the API has generated since the last poll automatically appear as new data points on the line.
When both prematch and live predictions have numeric values, the expanded panel also shows a side-by-side comparison. There are two cards, one for each type, with their own probability bars. Below that, a shift indicator tells you how much the home team's probability has changed since the pre-game assessment. Something like "NYY shifted +7% since prematch" gives the user an instant sense of game momentum.
Team Form and Head-to-Head context
Predictions in isolation are interesting. Predictions with context are useful.
The Highlightly Baseball API gives us two endpoints that add exactly the context we need.
GET /last-five-games?teamId={id}
returns the last five finished games for a specific team. We parse
each game's
state.score.current field relative to
the queried team ID to determine whether it was a win, loss, or draw:
          MLB.parsers.parseFormArr = function (data, teamId) {
  if (!Array.isArray(data)) return [];

  return data.slice(0, 5).map((match) => {
    const scoreStr = match.state?.score?.current;
    if (!scoreStr) return 'D';

    const [homeStr, awayStr] = `${scoreStr}`.split(/\s*-\s*/);
    const homeScore = parseInt(homeStr, 10) || 0;
    const awayScore = parseInt(awayStr, 10) || 0;
    const isHome = match.homeTeam?.id === teamId;
    const teamScore = isHome ? homeScore : awayScore;
    const oppScore = isHome ? awayScore : homeScore;

    if (teamScore > oppScore) return 'W';
    if (teamScore < oppScore) return 'L';
    return 'D';
  });
};
The result is a simple array like
["W", "W", "L", "W", "L"]. The
FormBadge component renders these as
compact colored boxes. Green for wins, red for losses. Placed side by
side for both teams on the prediction card, it tells you instantly
who's hot and who's struggling.
GET /head-2-head?teamIdOne={id}&teamIdTwo={id}
returns up to ten past meetings between two specific teams. We count
wins per side and extract the scores and dates. The
H2HBar component shows this as a
proportional split bar. If the home team has won 6 of the last 10, the
bar is 60% green and 40% yellow. Below the bar, the individual game
scores appear as compact chips with date labels.
Both of these endpoints are fetched in parallel with the match detail
when the user expands a card. We use
Promise.allSettled so that if one
call fails the rest of the
card still renders perfectly.
Integrating Bookmaker Odds
The odds endpoint rounds out the prediction story. Where the AI model says "Yankees at 58%", the bookmakers might say "Yankees at 1.65 decimal odds". When those numbers agree, the prediction feels solid. When they diverge, that's where it gets interesting.
GET /odds?matchId={id}&limit=5
returns odds from multiple bookmakers. The response structure looks
like this:
          {
  "data": [
    {
      "matchId": 394,
      "odds": [
        {
          "bookmakerName": "DraftKings",
          "type": "prematch",
          "market": "Home/Away",
          "values": [
            { "odd": 1.65, "value": "Home" },
            { "odd": 2.25, "value": "Away" }
          ]
        },
        {
          "market": "Over/Under 8.5",
          "values": [
            { "odd": 1.91, "value": "Over" },
            { "odd": 1.91, "value": "Under" }
          ]
        }
      ]
    }
  ]
}
The markets available include Home/Away (moneyline), Over/Under (totals), Asian Handicap, and Odd or Even. For our dashboard, we focus on Home/Away and Over/Under since those are the most relevant to predictions.
Parsing requires grouping by bookmaker name, then extracting the Home and Away values from the Home/Away market:
          for (const odds of allOdds) {
  const name = odds.bookmakerName || 'Bookmaker';
  const market = (odds.market || '').toLowerCase();
  const values = odds.values || [];

  if (!byBookmaker[name]) {
    byBookmaker[name] = {
      bookmaker: name, homeML: null, awayML: null, overUnder: null,
    };
  }

  const book = byBookmaker[name];

  if (market.includes('home/away')) {
    for (const v of values) {
      const side = (v.value || '').toLowerCase();
      if (side === 'home') book.homeML = v.odd;
      if (side === 'away') book.awayML = v.odd;
    }
  }

  if (market.includes('over/under')) {
    const lineMatch = odds.market.match(/[\d.]+/);
    if (lineMatch) book.overUnder = parseFloat(lineMatch[0]);
  }
}
The OddsTable component renders this
as a compact grid with the bookmaker name, home odds, away odds, and
the over/under line. Odds are displayed in European decimal format,
which is what the API returns.
The odds endpoint requires a paid Highlightly plan. On the free tier, it returns an error. The app handles this gracefully with a subtle notice instead of a broken table. Prematch odds refresh multiple times a day. Live odds refresh every ten minutes. Odds data is available up to 28 days after a game finishes and 7 days before it starts.
Venue, Weather and Match Details
When you call GET /matches/{id} for
the detail view, you get more than just predictions. The response
includes venue information, a weather forecast, play-by-play data,
team rosters, and umpire assignments.
For our dashboard, we use the venue displayed in the card header, and the weather forecast shown in the expanded panel footer. Something like "cloudy · 11.97°C" gives users a quick sense of game day conditions.
We didn't use the rest of the detail data in this tutorial, but it's worth knowing what's there because these are natural extension points:
-
The
playsarray contains pitch-by-pitch data with pitch type (CURVE, FASTBALL, etc.), velocity, ball-strike counts, and scoring information. -
The
rostersobject has the full lineup for both teams with jersey numbers, positions, and a starter flag. -
The
statsarray has team-level batting, pitching, and fielding statistics aggregated for the match. -
refereestells you who's calling the game.
These are all available from the same single API call you're already making.
Putting It All Together
When a user taps a card, a lot happens in a very short time. Five API
calls fire simultaneously using
Promise.allSettled:
          const [d, o, hf, af, hh] = await Promise.allSettled([
  fetchDetail(match.id, apiKey),           // Predictions + venue + weather
  fetchOdds(match.id, apiKey),             // Bookmaker odds
  fetchLastFive(home.id, apiKey),          // Home team form
  fetchLastFive(away.id, apiKey),          // Away team form
  fetchH2H(home.id, away.id, apiKey),     // Head-to-head history
]);
We use allSettled instead of
Promise.all for a deliberate reason:
if the odds call fails (you're on a free plan) or the H2H call returns
empty (it's a rare inter-league matchup with no history), the other
four results still render. Each endpoint failure is isolated.
The match detail endpoint returns an array with a single object.
While the data is loading, shimmer placeholders fill the expanded panel at the exact heights of the sections they'll replace. For live games, after the initial fetch, a polling interval kicks in. Every 60 seconds, we re-fetch the match detail, parse the updated predictions, and rebuild the chart. The user sees the game evolving in near real-time without any manual refresh.
Project Architecture and Code Organization
Let's zoom out and look at how the codebase is structured. The modular organization makes it easy to find, read, and modify any piece of the application.
js/api/ - Four files, one per concern.
client.js owns the fetch wrapper,
base URL, and key validation.
matches.js,
odds.js, and
teams.js each wrap their respective
endpoints. If Highlightly changes their base URL or auth header
tomorrow, you change one line in
client.js and everything works.
js/parsers/ - Five files that mirror the API layer.
predictions.js is the most complex
(~100 lines) because it handles the prematch/live structure,
percentage string parsing, and live history extraction.
js/components/ - Nine JSX files ranging from 20-line
leaf components (TypeBadge,
TeamLogo) to the 250-line
GameCard which orchestrates the
expand flow, polling, and history recording.
js/utils/ - Three files of pure functions which include date helpers, display formatters, and the confidence tier calculator.
Everything communicates through the
window.MLB namespace. Components
destructure what they need at the top of their function:
          const { parseTeam, parseStatus, parseScore, parseAllPreds } = MLB.parsers;
const { fetchDetail, fetchOdds, fetchLastFive, fetchH2H } = MLB.api;
const { PredictionChart, PredBar, TypeBadge, OddsTable } = MLB.components;
Script load order in
index.html matters. Utilities load
first, then the API layer, then parsers, then components, then the
app, then the mount. For production, you'd migrate to Vite or esbuild
and get proper ES module imports. But for a tutorial project, the
simplicity is worth it.
For the full code, a sample GitHub project can be found here.
Going Further
The dashboard we built covers predictions, odds, form, and head-to-head history. But the Highlightly Baseball API has several more endpoints that are natural extensions:
-
Highlights -
GET /highlights?matchId={id}returns video clips with game recaps, live events, post-match interviews. You can embed these directly using theembedUrlfield. -
Standings -
GET /standings?leagueType=MLB&year=2026provides divisional standings with win-loss records. Adding a small badge like "1st in AL East" to each team gives instant context. -
Box Scores -
GET /box-scores/{id}returns per-player batting and pitching statistics for a specific game. -
Lineups -
GET /lineups/{matchId}provides starting lineups a few hours before game time. -
Player Statistics -
GET /players/{id}/statisticsgives per-season stats. Combine this with our player stats dashboard tutorial and you've got a serious analytics tool. -
NCAA Coverage - Everything we built works for
college baseball too. The API covers NCAA with the same endpoints -
just pass
league=NCAAin your match queries.
If you're thinking about taking this to production, consider migrating from Babel standalone to a proper bundler like Vite for faster load times. You could also persist prediction history to a database and build a long-term accuracy tracker.
Wrapping Up
We started with an empty folder and ended with a production-quality predictions dashboard that pulls real-time data from the Highlightly Baseball API. The app displays live win probabilities, plots them over time with Chart.js, compares bookmaker odds from multiple providers, and adds context through team form streaks and head-to-head history.
If you want to explore the API further, the full Baseball API documentation covers every endpoint with response schemas and example payloads. The blog section has more tutorials, including guides on player stats dashboards and monetising sports data.